This page features a collection of articles that I’ve written for my blog on the topic of data analysis. In these articles, I provide detailed explanations of how I’ve approached analyzing different types of data, including how I’ve created visualizations such as graphs and maps to draw conclusions from that data.
If you’re interested in learning more about data analysis, these articles are a great resource. Whether you’re a student, researcher, or simply interested in exploring data, you’ll find useful insights and techniques that can help you understand and analyze data more effectively.
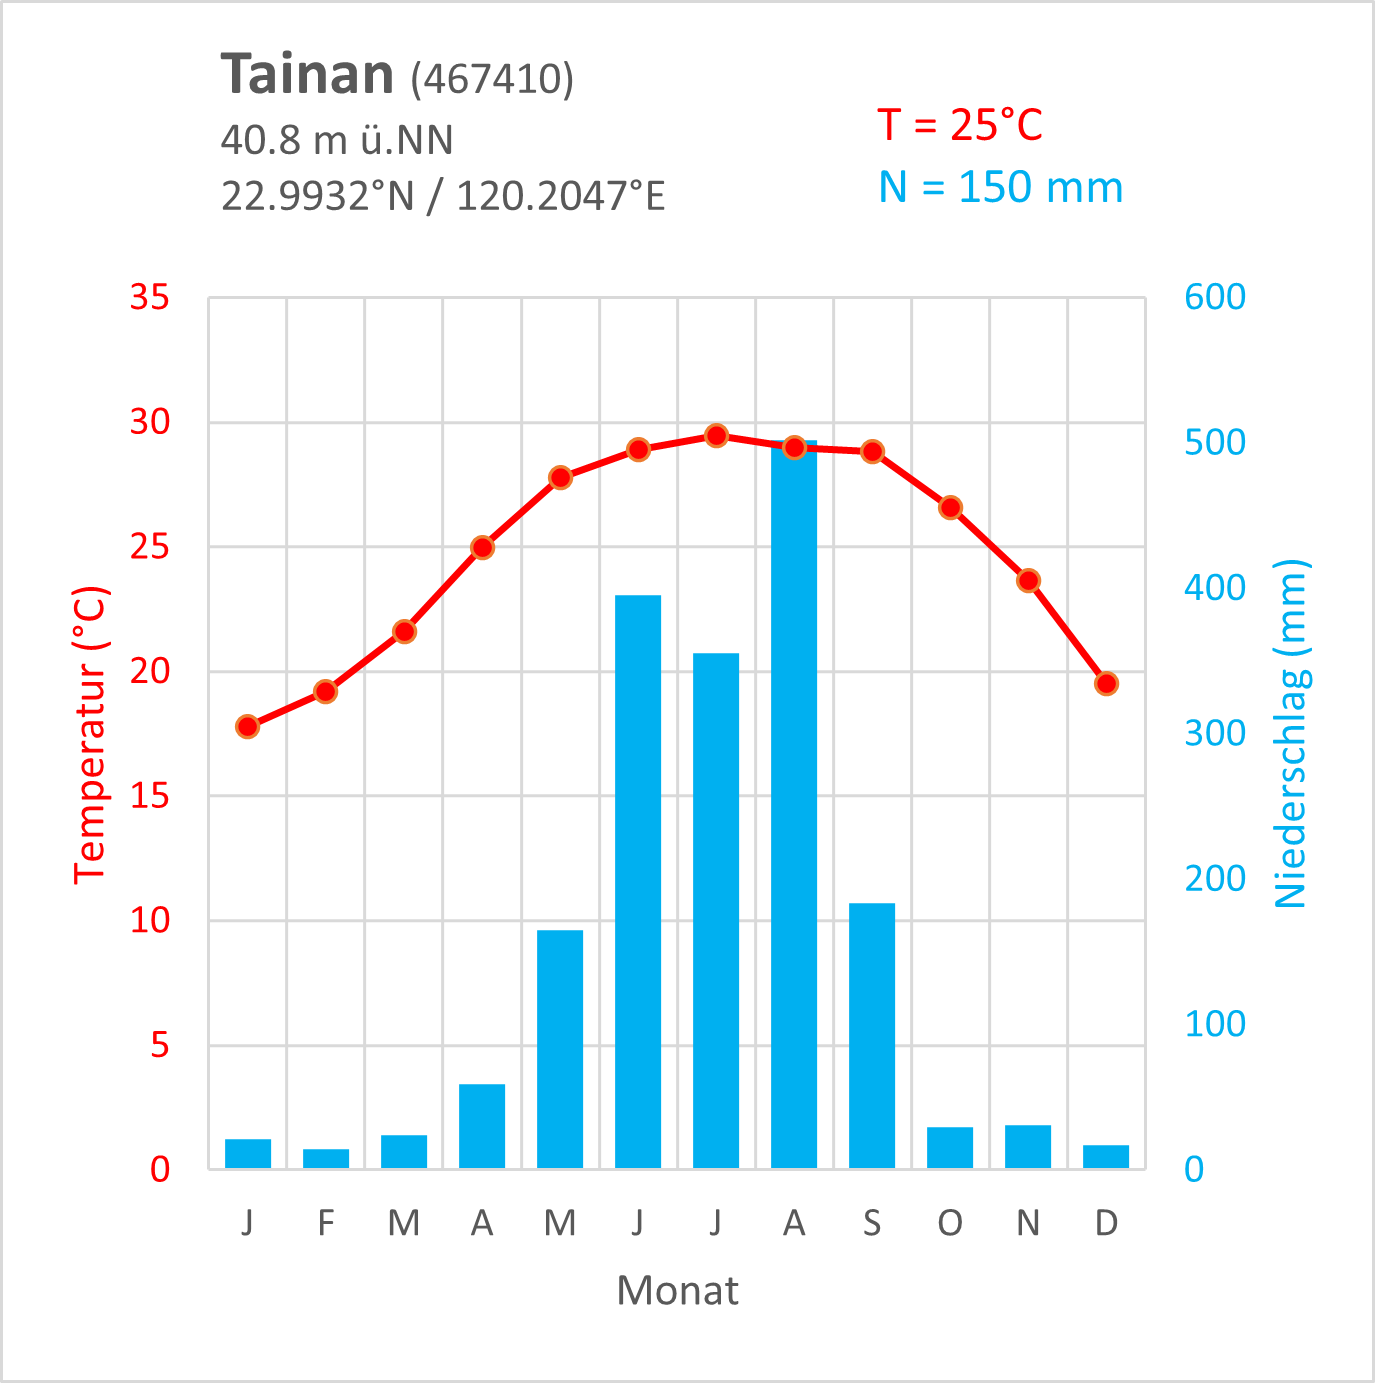
How to Create Climate Diagrams with R and Excel

This article is related to the German blog post: “Warum man im Sommer nicht nach Taiwan reisen sollte” (Why You Should Not Travel to Taiwan in Summer), where I showcased two different types of climate diagrams.
In this article, I’ll explain what these diagrams are and how I created them using raw data from the Central Weather Bureau Taiwan. To read the article click here.
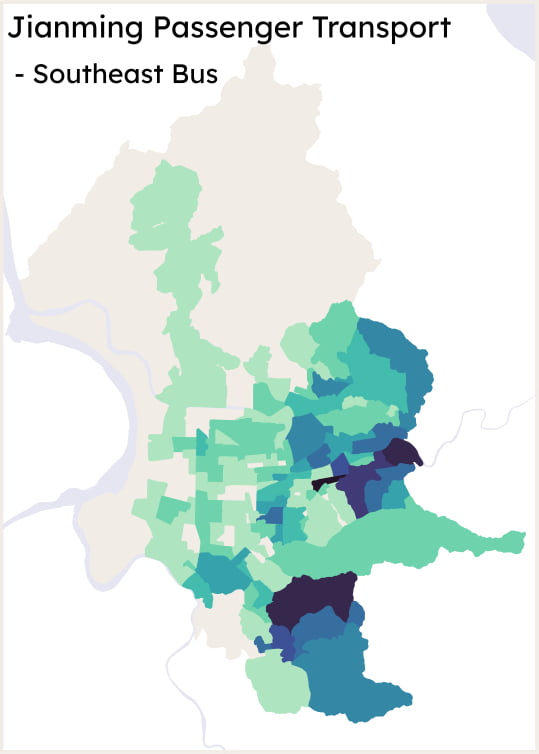
Analyzing Taipei’s Bus Network

This article is related to the blog post “Revealing Taipei’s Bus Labyrinth: Surprising Insights, Dynamics, and Details“, where I took a deeper look into the bus network of Taipei City.
In this article I describe the data sources and steps performed to reach the insights presented in the blog article. You can read the behind-the-scenes description here.